
Venezuela Earthquakes: Maps and Graphics Show Impact
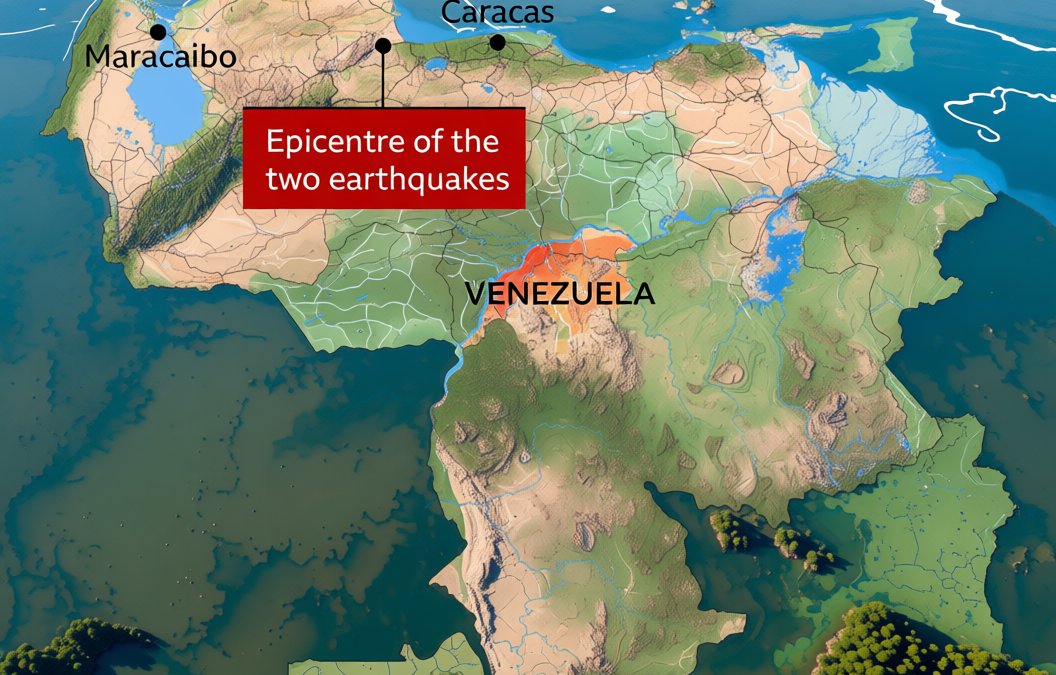
Venezuela earthquakes in maps and graphics have provided a vivid depiction of the regions affected and the potential severity of seismic events. Two powerful quakes, striking within seconds of each other, left a trail of destruction across multiple areas. The first tremor, measuring 7.2 on the Richter scale, hit 23km southeast of Yumare, a town west of Caracas, at 18:04 local time (22:04 GMT). Just minutes later, a 7.5-magnitude quake followed, causing even more widespread damage. These events, captured in detailed maps and visual data, revealed how proximity to the surface and population density can amplify the devastation. The country’s interior minister confirmed that Trujillo, Yaracuy, Carabobo, Aragua, and Miranda were among the hardest-hit zones.
Geological Context and Seismic Risk
Venezuela’s location at the convergence of the Caribbean and South American tectonic plates makes it susceptible to earthquakes. The recent quakes were triggered by the sudden movement of these plates, a phenomenon that has historically shaped the region’s seismic activity. Maps illustrating fault lines and historical earthquake patterns highlight the vulnerability of certain areas, particularly near the Andes mountain range. Graphics such as population density overlays and infrastructure maps help visualize the risk, showing how densely populated regions like Caracas are exposed to higher damage potential.
The USGS data on the quakes’ depths underscores the impact of geological factors. The first event occurred at a depth of 20.3km, while the second struck just 10km below the surface, leading to more intense shaking. This shallow depth, combined with the region’s urban development, explains the severe destruction observed in the aftermath. The maps and graphics also reveal the extent of ground rupture, with some areas experiencing cracks and structural failures that disrupted transportation and communication networks.
Human Impact and Recovery Efforts
The earthquakes caused immediate human suffering, with at least 164 fatalities and hundreds injured. A 10-storey hotel in La Guaira collapsed entirely, and homes in Caracas were reduced to rubble. The devastation has prompted emergency response teams to prioritize rescue operations, with local authorities declaring a state of emergency in several regions. Graphics of the affected areas, including aerial views of damaged buildings and evacuation routes, are being used to coordinate relief efforts. These visual tools help identify the most critical zones for aid distribution, ensuring resources reach those in need swiftly.
“I thought I was going to die,” a Venezuelan survivor described, capturing the chaos that unfolded during the disaster. Such testimonials, paired with maps showing the distribution of casualties and damaged infrastructure, emphasize the real-world consequences of seismic events. The USGS estimates that a major quake with a magnitude exceeding 8 could result in over 10,000 deaths, highlighting the need for improved preparedness. Graphics illustrating historical earthquake data and fault line activity offer insights into the likelihood of future events, informing both policymakers and the public about potential risks.
Following the quakes, international organizations and neighboring countries have offered assistance. The focus keyword “Venezuela earthquakes in maps and graphics” is being leveraged to share real-time updates and analysis. These resources are crucial for understanding the scale of destruction and planning recovery. Maps tracking the movement of debris and damaged structures, along with seismic hazard assessments, provide a comprehensive view of the crisis. The visuals also aid in communicating the urgency of the situation to a global audience.
As the search for survivors continues, the role of maps and graphics in documenting the quakes’ aftermath becomes evident. These tools not only help in assessing damage but also in tracking the progress of rescue and rebuilding efforts. The integration of geographic data with real-time reports allows for a clearer picture of the disaster’s impact, making it easier for experts and officials to make informed decisions. This combination of visual storytelling and factual data is essential for both immediate response and long-term resilience planning in Venezuela.